In the world of problem-solving and quality management, cause and effect diagrams are a powerful tool that can help teams visually map out and identify all potential underlying reasons for a specific issue. Also known as fishbone diagrams or Ishikawa diagrams, these diagrams are designed to provide a systematic way of looking at a problem from multiple angles, allowing for a comprehensive analysis of the root causes.
What is a Cause and Effect Diagram?
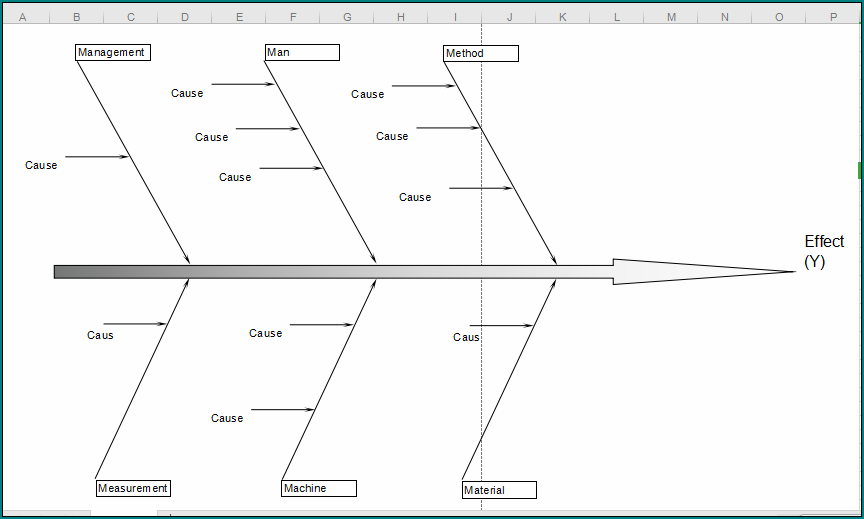
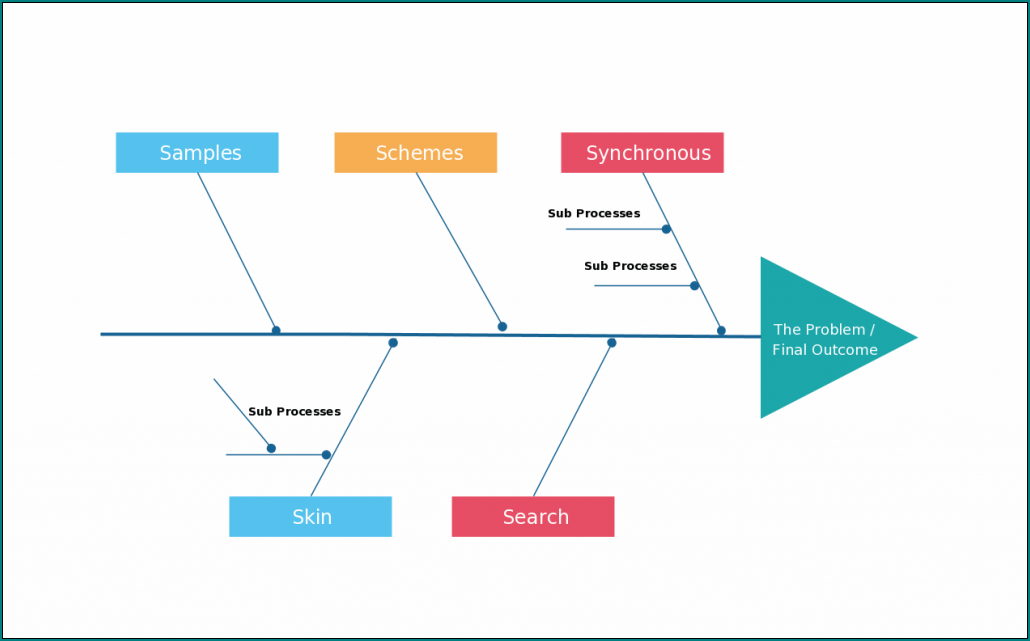
A cause and effect diagram is a visual tool used to systematically identify and organize the possible causes of a problem. The diagram takes its name from its shape, which resembles the skeletal structure of a fish, with the “head” representing the problem or quality issue at hand and the “bones” representing the various factors that may contribute to it. By breaking down the problem into its component parts, teams can gain a clearer understanding of the interconnected factors that may be at play.
Key Elements of a Cause and Effect Diagram
When creating a cause and effect diagram, there are several key elements to keep in mind:
- The Problem Statement: Clearly define the problem or quality issue that is being addressed.
- The Categories: Identify the main categories of factors that may contribute to the problem, such as people, processes, equipment, or environment.
- The Causes: Brainstorm and list out all potential causes within each category, ensuring that no possible factor is overlooked.
- The Relationships: Show the relationships between the causes and the problem, highlighting how each factor may be interconnected.
Why Use Cause and Effect Diagrams?
Cause and effect diagrams offer several benefits when it comes to problem-solving and quality improvement. By visually mapping out the potential causes of a problem, teams can:
- Gain a comprehensive understanding of the root causes of a quality issue.
- Identify areas for improvement and potential solutions.
- Promote collaboration and communication among team members.
- Facilitate data-driven decision-making based on evidence and analysis.
Samples of Cause And Effect Diagram Template:


How to Create a Cause and Effect Diagram
Creating a cause and effect diagram involves a few simple steps:
1. Start by clearly defining the problem or quality issue that needs to be addressed.
2. Identify the main categories of factors that may contribute to the problem.
3. Brainstorm and list out all potential causes within each category.
4. Draw the diagram, with the problem statement at the head and the categories branching out like fishbones.
5. Connect the causes to the categories, showing the relationships between them.
6. Analyze the diagram to identify the most likely root causes of the problem.
Tips for Using Cause and Effect Diagrams Effectively
To make the most of cause and effect diagrams, consider the following tips:
- Involve a Diverse Team: Bring together team members with different perspectives and expertise to ensure a comprehensive analysis.
- Focus on Data and Evidence: Use data and evidence to support your analysis and conclusions, rather than relying on assumptions or opinions.
- Update and Revise as Needed: Regularly review and update the diagram as new information becomes available or as the problem evolves.
- Use Software Tools: Consider using software tools or templates to create and collaborate on cause and effect diagrams more efficiently.
Conclusion
In conclusion, cause and effect diagrams are a valuable tool for uncovering the root causes of quality issues and problems in a systematic and structured way. By visually mapping out all potential factors that may contribute to a problem, teams can gain a deeper understanding of the issue at hand and develop more effective solutions. Whether you’re facing a complex quality issue or simply looking to improve your problem-solving process, cause and effect diagrams can help you navigate through the complexity and uncertainty to reach the heart of the matter.
Cause And Effect Diagram Template | Excel download
